Select a category to explore

Title
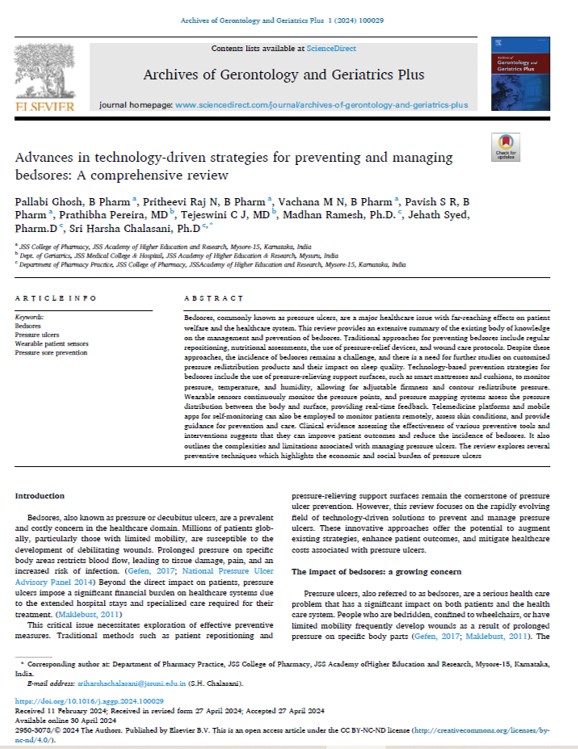
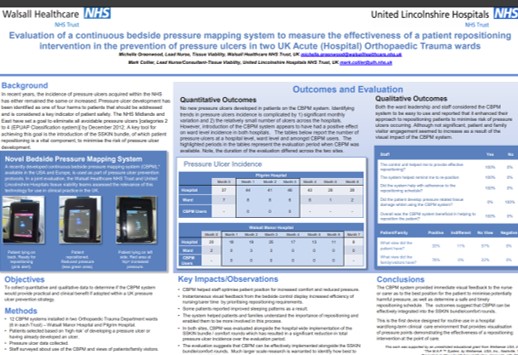
Visual Feedback of Continuous Bedside Pressure Mapping to Optimize Effective Patient Repositioning
Key Takeaway/s
Visual feedback from continuous bedside pressure mapping enabled caregivers to reposition patients more effectively, lowering high pressures and improving care. Read Full Article
Title
Key Takeaway/s
This UAB tertiary teaching-hospital study found that patients who developed hospital-acquired pressure ulcers incurred substantially higher costs and longer stays. Adjusted analyses showed costs of $29,048 vs $13,819 and length of stay of 20.9 vs 12.7 days, confirming pressure ulcers independently drive excess inpatient utilization beyond baseline severity. Read Full Article
Title
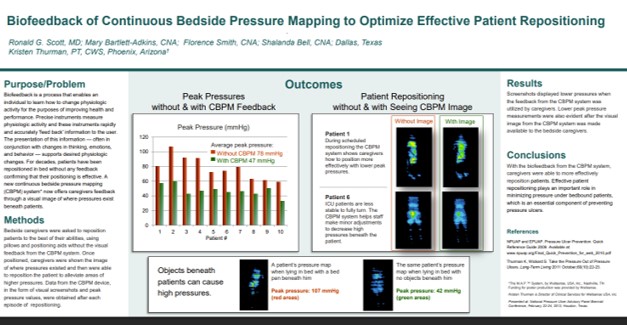
Biofeedback of Continuous Bedside Pressure Mapping to Optimize Effective Patient Repositioning
Key Takeaway/s
At a Dallas-area long-term acute care facility, real-time pressure visualization reduced average peak pressures by 40% – from 78 mmHg to 47 mmHg. 100% of caregivers reported more effective repositioning with the pressure image than without it, including for patients too medically complex to fully turn. Hidden objects beneath patients – including a bedpan producing… Read Full Article
Title
Key Takeaway/s
This peer-reviewed study found that when staff repositioned residents using feedback from a real-time pressure mapping system, peak interface pressures were significantly reduced (P = .016) and more preventive interventions were implemented (P = .012), demonstrating that pressure visualization directly improves the effectiveness of repositioning Read Full Article
Title
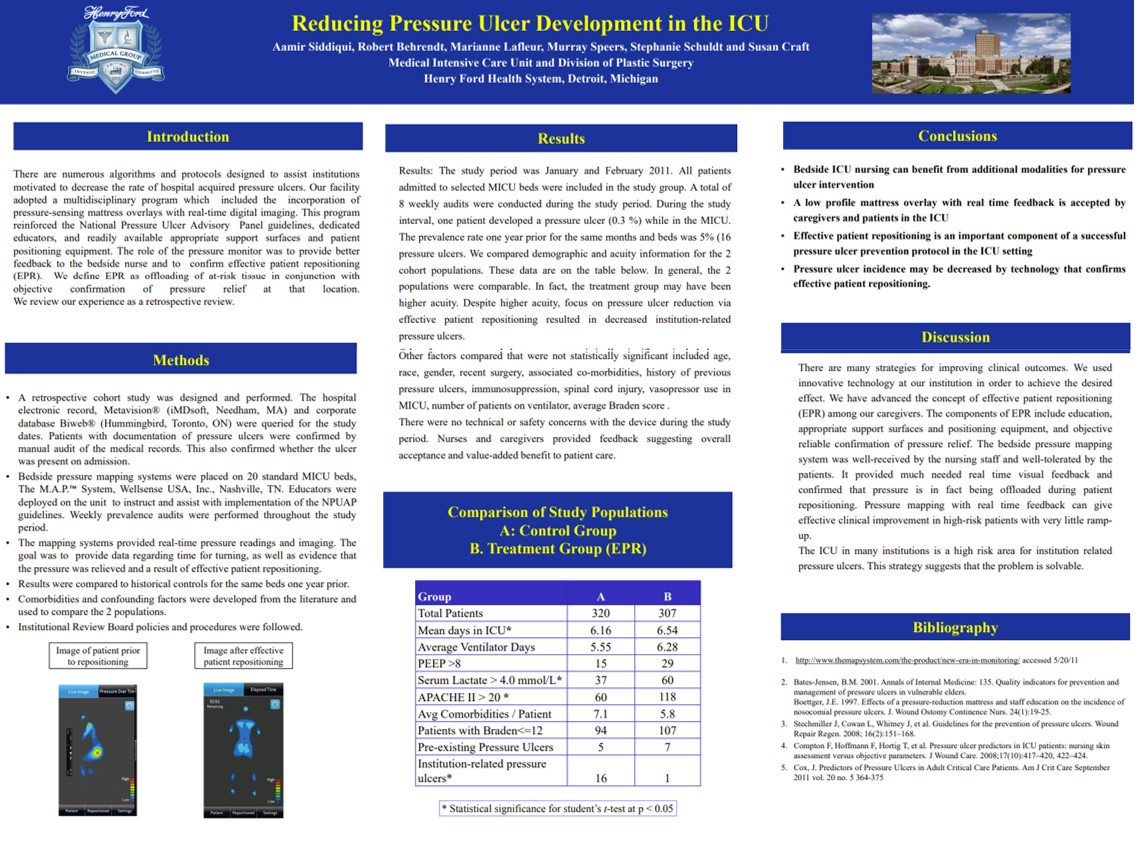
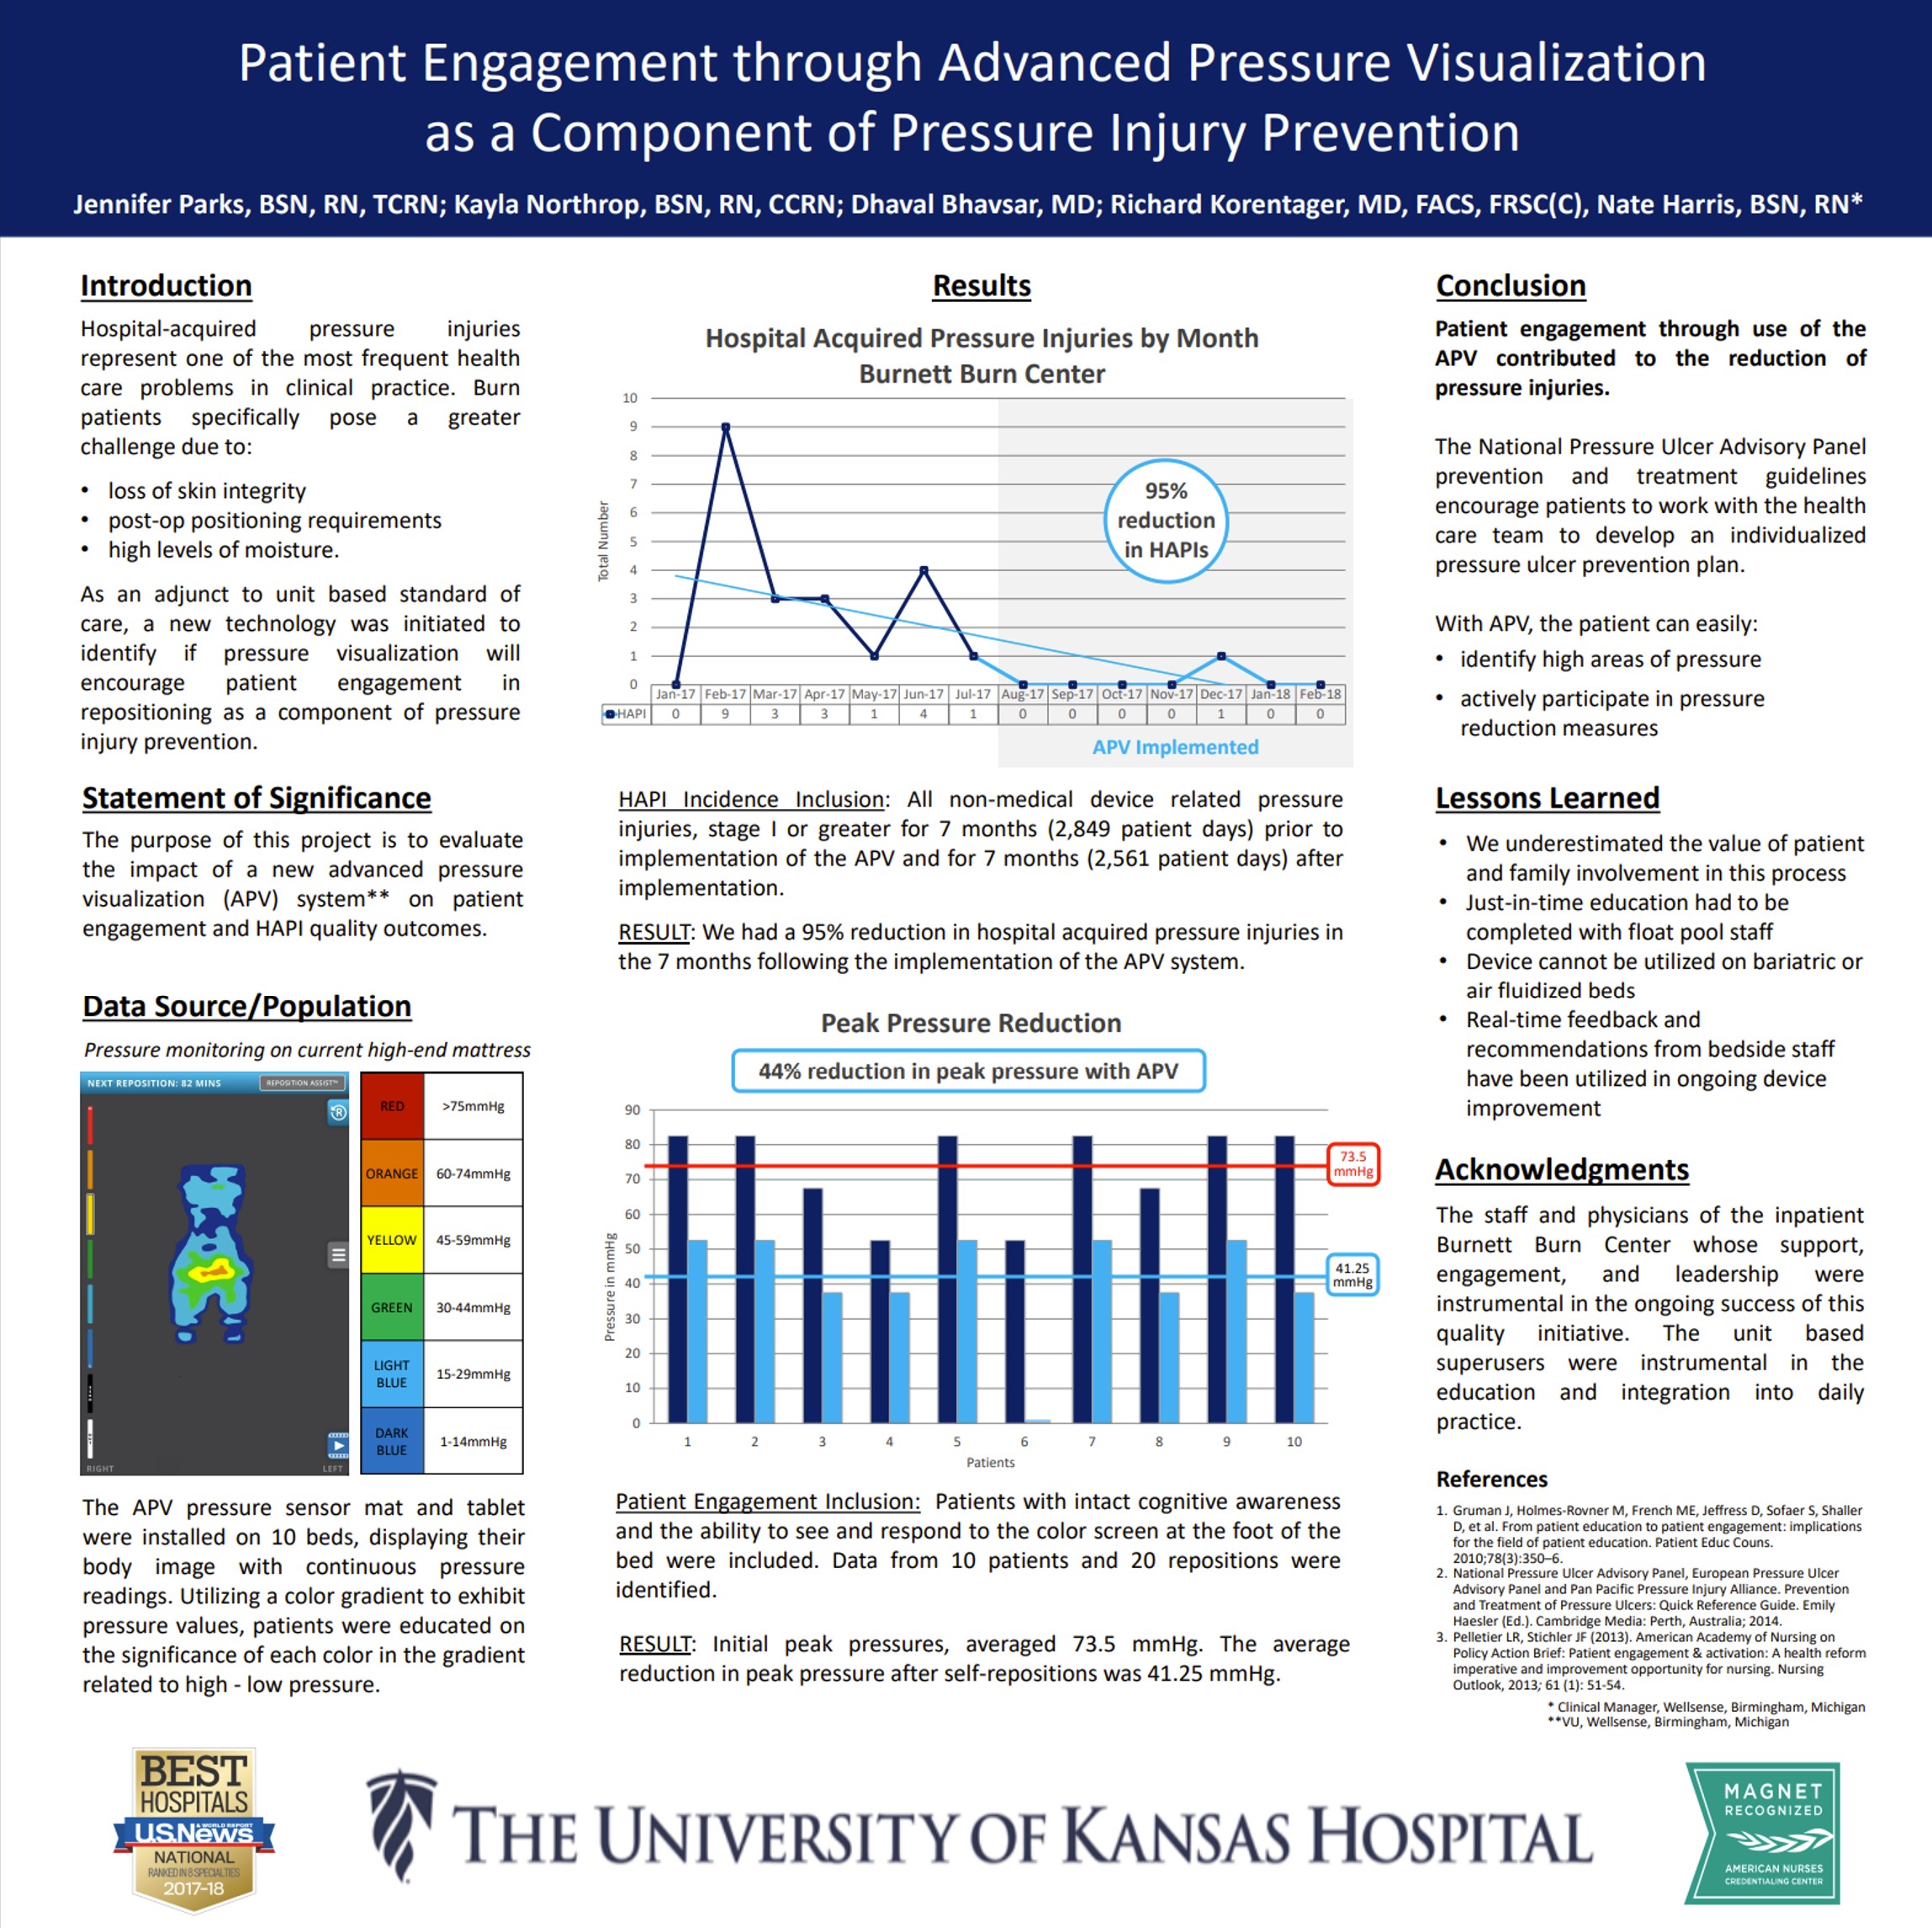
Reducing Pressure Ulcer Development in the ICU
Key Takeaway/s
At Henry Ford Health System’s Medical ICU (Detroit), implementing real-time pressure visualization on 20 ICU beds was associated with a ~94% reduction in institution-related pressure ulcers versus the same months the prior year (16 to 1; 5% to 0.3%). The study reported no technical or safety issues and strong caregiver acceptance. Read Full Article
Title
Key Takeaway/s
Real-time pressure mapping in ICUs, geriatric wards, operating rooms, and long-term care consistently showed that visual feedback allowed staff to identify high-risk zones, reposition more effectively, and prevent hospital-acquired pressure ulcers while also supporting wound healing. Read Full Article
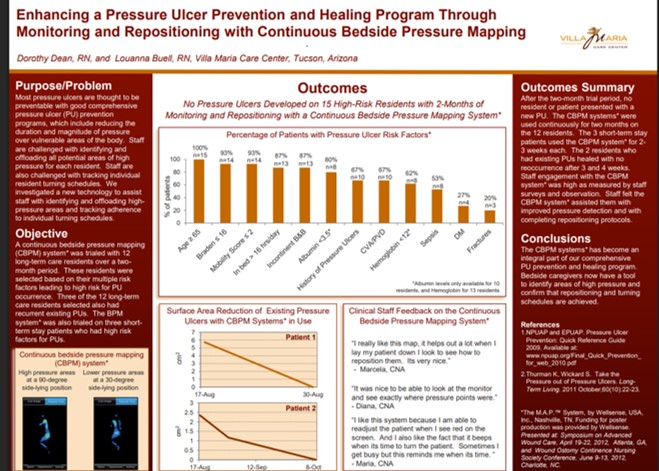
Title
Key Takeaway/s
At Villa Maria Care Center, Continuous Bedside Pressure Mapping over two months prevented all new pressure ulcers in 15 high-risk residents, supported healing of existing ulcers with no recurrence, and became an integral part of the pressure ulcer prevention program. Read Full Article
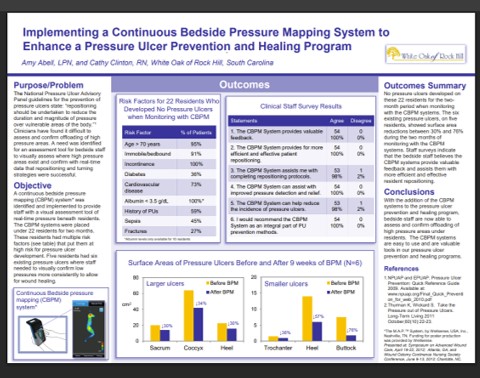
Title
Key Takeaway/s
At White Oak of Rock Hill, no new pressure ulcers developed in 22 high-risk residents monitored with bedside pressure visualization, while existing ulcers showed 30–76% surface area reduction within 9 weeks Read Full Article
Title
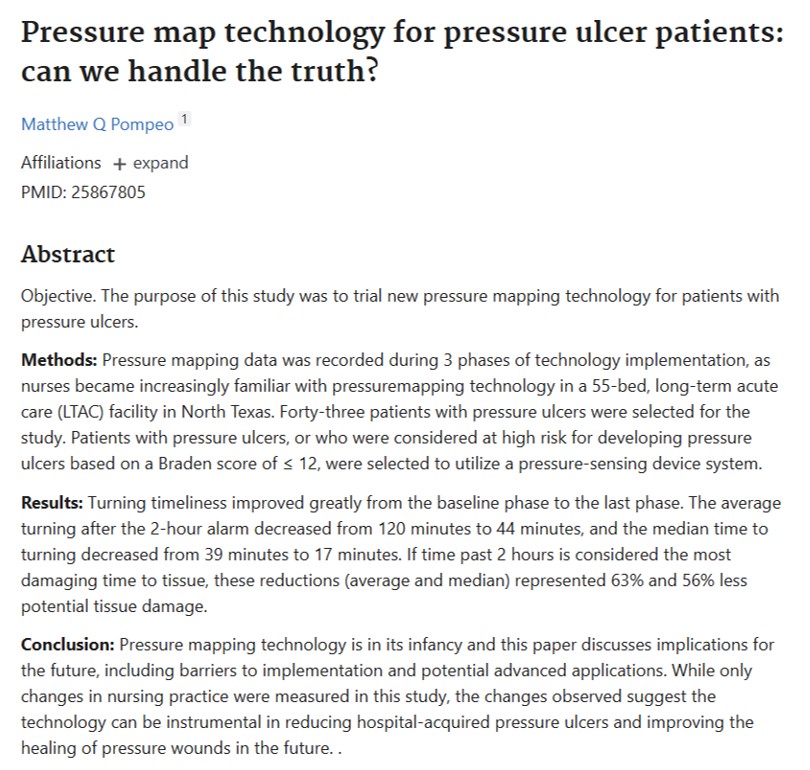
Pressure Map Technology for Pressure Ulcer Patients: Can We Handle the Truth?
Key Takeaway/s
In a 55-bed LTAC facility in North Texas, pressure mapping technology improved nursing practice, reducing average turn delays by 63% and median delays by 56%, thereby lowering risk of tissue damage. Read Full Article
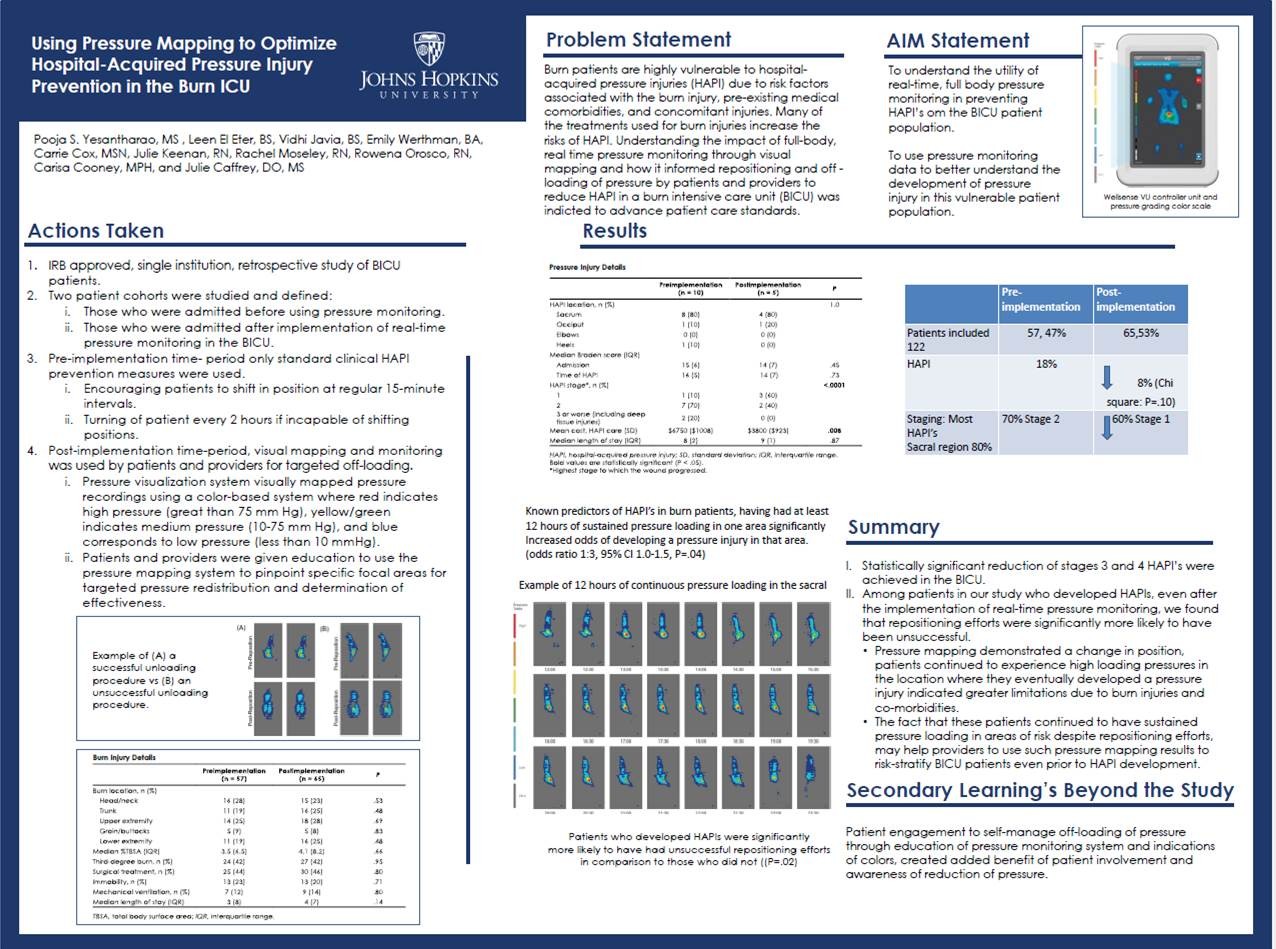
Title
Key Takeaway/s
This Hopkins burn ICU study found that implementing real-time pressure mapping reduced HAPI-related care costs from about $6,750 to $3,800 per patient. These savings reflect direct pressure-injury treatment costs only (e.g., wound care), not systemic complications or extended hospitalization, and were driven by fewer and less severe pressure injuries Read Full Article
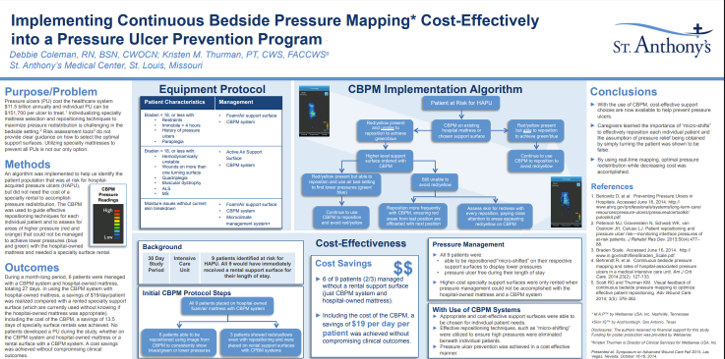
Title
Key Takeaway/s
At St. Anthony’s Medical Center, Continuous Bedside Pressure Mapping enabled use of lower-cost support surfaces, reducing reliance on specialty rentals and delivering net savings of $19 per patient per day after including the cost of the visualization system itself. Read Full Article
Title
Key Takeaway/s
In elderly care, pressure mapping directly supported staff education by improving pressure-injury awareness, strengthening repositioning decisions with visual feedback, and increasing the frequency and appropriateness of preventative interventions during routine care. Read Full Article
Title
Pressure Map Technology for Pressure Ulcer Patients: Can We Handle the Truth?
Key Takeaway/s
Pressure mapping improved workflow performance in a long-term acute care setting by reducing delays to scheduled turning, supporting more reliable execution of turning protocols, and creating clearer accountability around when repositioning actually occurs. Read Full Article
Title
Self-turning for Pressure Injury Prevention
Key Takeaway/s
Pressure visualization can be used as a structured education tool for appropriate patients, enabling them to learn and reliably perform self-repositioning with clear visual guidance, reducing staff burden while keeping turning technique verifiable. Read Full Article
Title
Key Takeaway/s
Across multiple care settings, the evidence supports pressure visualization as a workforce enablement tool: it makes prevention practices more consistent, improves staff decision-making with real-time feedback, and strengthens training and standardization of repositioning technique. Read Full Article
Title
Self-turning for Pressure Injury Prevention
Key Takeaway/s
When appropriate patients were identified as able to self-turn, real-time pressure visualization helped them reposition themselves reliably with clear, immediate feedback. This demonstrates that pressure visualization can actively engage patients in their own pressure management, supporting safer self-directed turning when clinically appropriate. Read Full Article
Title
Key Takeaway/s
This study frames pressure visualization as a patient-facing tool: by making pressure visible, it motivates participation and supports behavior change around repositioning. The work reinforces that engagement improves when patients can see the cause-and-effect of their own movement on pressure. Read Full Article
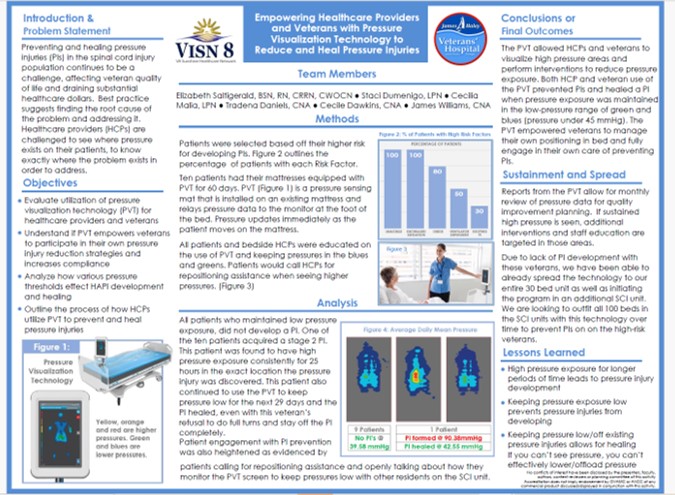
Title
Key Takeaway/s
In a veteran population, pressure visualization was used not only to guide clinical care but to empower patients and caregivers with understandable, visual information about pressure risk. This supports greater patient involvement in day-to-day positioning decisions and reinforces shared accountability for prevention and healing. Read Full Article
Title
Key Takeaway/s
In two acute orthopedic trauma wards, patients and families reported the pressure visualization system was helpful, indicating strong engagement with the care process. The findings suggest that making pressure visible can improve patient and family understanding of repositioning goals and increase participation in prevention efforts. Read Full Article
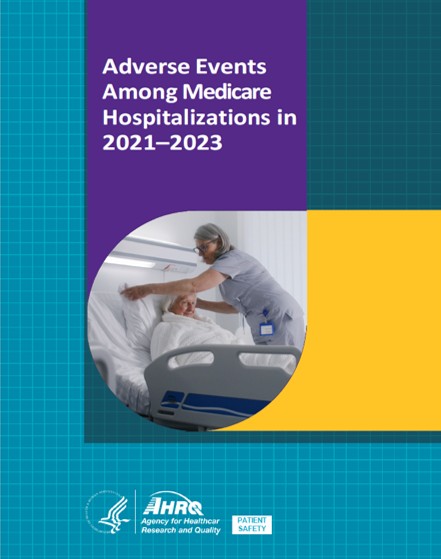
Title
Adverse Events Among Medicare Hospitalizations in 2021-2023
Key Takeaway/s
Pressure injuries represent 34.2% of all HACs, 43.5% of all HAC-related deaths, and are the only HAC that continues to grow — rising 14% over the last three years. (Mortality rates: AHRQ, November 2017) Read Full Article
Title
Key Takeaway/s
Pressure injuries represent 26.7% of all hospital-acquired conditions, 43.2% of all HAC-related deaths and are the only HAC that has continued to rise (by 6%) while all others declined. Read Full Article
Title
Key Takeaway/s
Patients who develop a pressure injury face a 3.26 times greater risk of death – generating 41 excess deaths per 1,000 cases. This is the highest mortality risk of any non-infectious hospital-acquired condition, exceeding falls, adverse drug events, surgical site infections, venous thromboembolism, and obstetric adverse events. Read Full Article
Title
Key Takeaway/s
Key Takeaways For the average 160-bed US hospital, preventable pressure injuries generate $5.97 million in annual financial risk – $3.87 million in lost reimbursement, $2.1 million in litigation exposure, 911 added hospital days, 149 patients who could not be admitted, and 16.4 deaths. Every one of those costs is unreimbursed, unavoidable, and growing. Read Full Article
Title
The national cost of hospital-acquired pressure injuries in the United States
Key Takeaway/s
This 2019 study estimated that each hospital-acquired pressure injury adds about $10,708 per patient on average (≈ $14,500 today), calculated by distributing the total national HAPI cost burden across all patients who develop a HAPI, contributing to $26.8 billion annually (≈ $36.5 billion today). Read Full Article
Title
Value of hospital resources for effective pressure injury prevention: a cost-effective analysis
Key Takeaway/s
This peer-reviewed BMJ Quality & Safety cost-effectiveness study analyzed 34,000+ hospital patients and quantified the financial impact of severe pressure injuries. It reported that Stage 3–4 (full-thickness) pressure injuries add about $6,209 per patient-day, underscoring the high daily cost burden and the value of effective, hospital-wide prevention. Read Full Article
Title
Key Takeaway/s
Despite CMS payment penalties and widespread adoption of prevention guidelines, severe pressure ulcer prevalence – Stages 3, 4, and unstageable – increased from 2008 to 2019. Between 2013 and 2016 alone, PI rates rose 29.4%, the only hospital-acquired condition to increase, while every other HAC declined. The most dangerous injuries are getting more common, not… Read Full Article
Title
Key Takeaway/s
Overall, the annual prevalence of pressure injuries and annual mean hospitalization cost increased ($69,499.29 to $102,939.14). Read Full Article
Title
Key Takeaway/s
This 2020 national hospital database study concluded that each hospital-acquired pressure injury added about $21,767 in hospital cost per patient versus no pressure injury, equal to about $30,000 in 2026 dollars. Read Full Article